将ECharts图表插入到Word文档中

如何通过ECharts在后台生成图片,然后插入到Word文档中?

首先要解决一个问题:总所周知,ECharts是前端的一个图表库,如何在后台调用JS代码?这里就要用到PhantomJS了。

PhantomJS是一个基于WebKit的JavaScript API,它使用QtWebKit作为核心浏览器的功能,使用WebKit编译、解释和执行JavaScript代码。任何可以在基于WebKit的浏览器上做的事情,它都能做到。它不仅是一个隐形的浏览器,提供了诸如CSS选择器、支持Web标准、DOM操作、JSON、HTML5、Canvas、SVG等功能,同时也提供了处理文件I/O的操作。

之前写过一个文档模板工具,其中可以通过占位符插入图片。

用PhantomJS生成ECharts图表的Png图片,利用文档模板工具插入图片即可实现这个需求。

下面就来看看如何实现。

在后端调用JS代码

创建一个.netstandard2.1的类库项目。为了方便调用,我们安装一个PhantomJS包装器:NReco.PhantomJS

1
dotnet add package NReco.PhantomJS --version 1.1.0

这只是一个包装器,因此还需要一个可执行文件,前往官网下载PhantomJS。

因为直接使用编译好的可执行文件,因此需要下载对应的平台版本,这里我下载了Windows以及Linux 64-bit版本。

将下载好的可执行文件解压放置在项目根目录下的libs目录中。

在这里插入图片描述

这样我们可以直接在.net中调用PhantomJS了。

准备ECharts库

jQuery

下载jquery-3.6.3.min.js: https://code.jquery.com/jquery-3.6.3.min.js

ECharts

下载echarts.min.js: https://github.com/apache/echarts/tree/5.4.3/dist

ECharts转换器

echarts-convert在github上有众多版本,echarts-convert的代码来源于这里:https://github.com/wadezhan/billfeller.github.io/issues/85

这里选择

1
2
3
4
5
6
7
8
9
10
11
12
13
14
15
16
17
18
19
20
21
22
23
24
25
26
27
28
29
30
31
32
33
34
35
36
37
38
39
40
41
42
43
44
45
46
47
48
49
50
51
52
53
54
55
56
57
58
59
60
61
62
63
64
65
66
67
68
69
70
71
72
73
74
75
76
77
78
79
80
81
82
83
84
85
86
87
88
89
90
91
92
93
94
95
96
97
98
99
100
101
102
103
104
105
106
107
108
109
110
111
112
113
114
115
116
117
118
119
120
121
122
123
124
125
126
127
128
129
130
131
132
133
134
135
136
137
138
139
140
141
142
143
144
145
146
147
148
149
150
151
152
153
154
155
156
157
158
159
160
161
162
163
164
165
166
167
168
169
170
171
172
173
174
175
176
177
178
179
180
181
(function () {
var system = require('system');
var fs = require('fs');
var config = {
// define the location of js files
JQUERY: 'jquery-3.6.3.min.js',
//ESL: 'esl.js',
ECHARTS: 'echarts.min.js',
// default container width and height
DEFAULT_WIDTH: '1920',
DEFAULT_HEIGHT: '800'
}, parseParams, render, pick, usage;

usage = function () {
console.log("\nUsage: phantomjs echarts-convert.js -options options -outfile filename -width width -height height"
+ "OR"
+ "Usage: phantomjs echarts-convert.js -infile URL -outfile filename -width width -height height\n");
};

pick = function () {
var args = arguments, i, arg, length = args.length;
for (i = 0; i < length; i += 1) {
arg = args[i];
if (arg !== undefined && arg !== null && arg !== 'null' && arg != '0') {
return arg;
}
}
};

parseParams = function () {
var map = {}, i, key;
console.log("--logs:\n")
console.log(system.args)
if (system.args.length < 2) {
usage();
phantom.exit();
}
for (i = 0; i < system.args.length; i += 1) {
if (system.args[i].charAt(0) === '-') {
key = system.args[i].substr(1, i.length);
if (key === 'infile') {
// get string from file
// force translate the key from infile to options.
key = 'options';
try {
map[key] = fs.read(system.args[i + 1]).replace(/^\s+/, '');
} catch (e) {
console.log('Error: cannot find file, ' + system.args[i + 1]);
phantom.exit();
}
} else {

map[key] = system.args[i + 1].replace(/^\s+/, '');
}
}
}
return map;
};

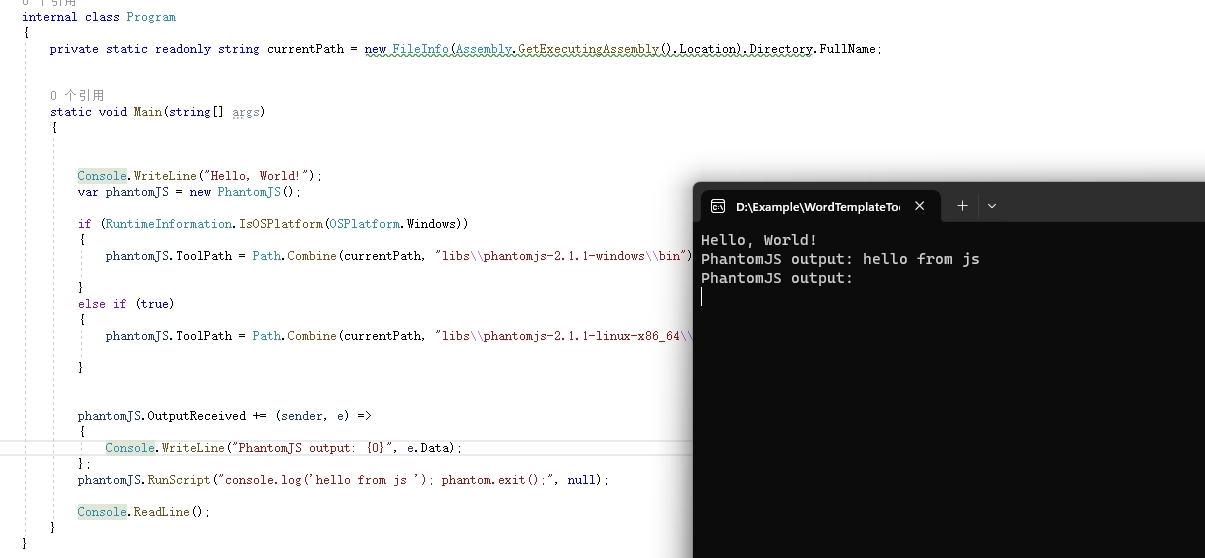
render = function (params) {
var page = require('webpage').create(), createChart;

var bodyMale = config.SVG_MALE;
page.onConsoleMessage = function (msg) {
console.log(msg);
};

page.onAlert = function (msg) {
console.log(msg);
};

createChart = function (inputOption, width, height, config) {
var counter = 0;
function decrementImgCounter() {
counter -= 1;
if (counter < 1) {
console.log(messages.imagesLoaded);
}
}

function loadScript(varStr, codeStr) {
var script = $('<script>').attr('type', 'text/javascript');
script.html('var ' + varStr + ' = ' + codeStr);
document.getElementsByTagName("head")[0].appendChild(script[0]);
if (window[varStr] !== undefined) {
console.log('Echarts.' + varStr + ' has been parsed');
}
}

function loadImages() {
var images = $('image'), i, img;
if (./Assets/images.length > 0) {
counter = images.length;
for (i = 0; i < images.length; i += 1) {
img = new Image();
img.onload = img.onerror = decrementImgCounter;
img.src = images[i].getAttribute('href');
}
} else {
console.log('The images have been loaded');
}
}
// load opitons
if (inputOption != 'undefined') {
// parse the options
loadScript('options', inputOption);
// disable the animation
options.animation = false;
}

// we render the image, so we need set background to white.
$(document.body).css('backgroundColor', 'white');
var container = $("<div>").appendTo(document.body);
container.attr('id', 'container');
container.css({
width: width,
height: height
});
// render the chart
var myChart = echarts.init(container[0]);
myChart.setOption(options);
// load images
loadImages();
return myChart.getDataURL();
};

// parse the params
page.open("about:blank", function (status) {
// inject the dependency js
page.injectJs(config.ESL);
page.injectJs(config.JQUERY);
page.injectJs(config.ECHARTS);


var width = pick(params.width, config.DEFAULT_WIDTH);
var height = pick(params.height, config.DEFAULT_HEIGHT);

// create the chart
var base64 = page.evaluate(createChart, params.options, width, height, config);
//fs.write("base64.txt", base64);
// define the clip-rectangle
page.clipRect = {
top: 0,
left: 0,
width: width,

height: height
};
// render the image
page.render(params.outfile);
console.log('render complete:' + params.outfile);
// exit
phantom.exit();
});
};
// get the args
var params = parseParams();

// validate the params
if (params.options === undefined || params.options.length === 0) {
console.log("ERROR: No options or infile found.");
usage();
phantom.exit();
}
// set the default out file
if (params.outfile === undefined) {
var tmpDir = fs.workingDirectory + '/tmp';
// exists tmpDir and is it writable?
if (!fs.exists(tmpDir)) {
try {
fs.makeDirectory(tmpDir);
} catch (e) {
console.log('ERROR: Cannot make tmp directory');
}
}
params.outfile = tmpDir + "/" + new Date().getTime() + ".png";
}

// render the image
render(params);
}());

将上述文件放在项目根目录下的js目录中。

在这里插入图片描述

我们来测试一下是否能生成一个简单的ECharts图表。

创建一个option.json

在这里插入图片描述

首先指定一个option,在官方示例 https://echarts.apache.org/examples/zh/index.html 中,随意找一个柱状图的sample,复制option对象内容到新创建的option.json文件中

1
2
3
4
5
6
7
8
9
10
11
12
13
14
15
16
17
18
19
20
21
22
23
24
25
26
27
28
29
30
31
32
33
34
35
36
{
"tooltip": {
"trigger": "axis",
"axisPointer": {
"type": "shadow"
}
},
"grid": {
"left": "3%",
"right": "4%",
"bottom": "3%",
"containLabel": true
},
"xAxis": [
{
"type": "category",
"data": [ "Mon", "Tue", "Wed", "Thu", "Fri", "Sat", "Sun" ],
"axisTick": {
"alignWithLabel": true
}
}
],
"yAxis": [
{
"type": "value"
}
],
"series": [
{
"name": "Direct",
"type": "bar",
"barWidth": "60%",
"data": [ 10, 52, 200, 334, 390, 330, 220 ]
}
]
}

Program.cs中调用ECharts转换器:

1
2
3
4
5
6
7
8
9
10
11
12
13
14
15
16
17
18
19
20
21
22
23
24
25
26
27
28
static void Main(string[] args)
{
var phantomJS = new PhantomJS();

if (RuntimeInformation.IsOSPlatform(OSPlatform.Windows))
{
phantomJS.ToolPath = Path.Combine(basePath, "libs\\phantomjs-2.1.1-windows\\bin");

}
else if (RuntimeInformation.IsOSPlatform(OSPlatform.Linux))
{
phantomJS.ToolPath = Path.Combine(basePath, "libs\\phantomjs-2.1.1-linux-x86_64\\bin");

}
var scriptPath = Path.Combine(basePath, "js\\echarts-converts.js");

var optionPath = Path.Combine(basePath, "js\\option.json");

phantomJS.OutputReceived += (sender, e) =>
{
Console.WriteLine("PhantomJS output: {0}", e.Data);
};

phantomJS.Run(scriptPath, new string[] { "-infile", optionPath });
phantomJS.Abort();

}

打印如下

在这里插入图片描述

打开输出路径看到生成的图片。

在这里插入图片描述

生成Word文档

为了方便集成,我加.NET中构件ECharts中可能用的全部数据结构。
这里感谢https://github.com/idoku/EChartsSDK这个项目,代码基本都是从这里拷贝过来的。

这样可以通过指定ChartOption对象,生成图片。

1
2
3
4
5
6
7
8
9
10
11
12
13
14
15
16
17
18
19
20
21
22
23
24
25
26
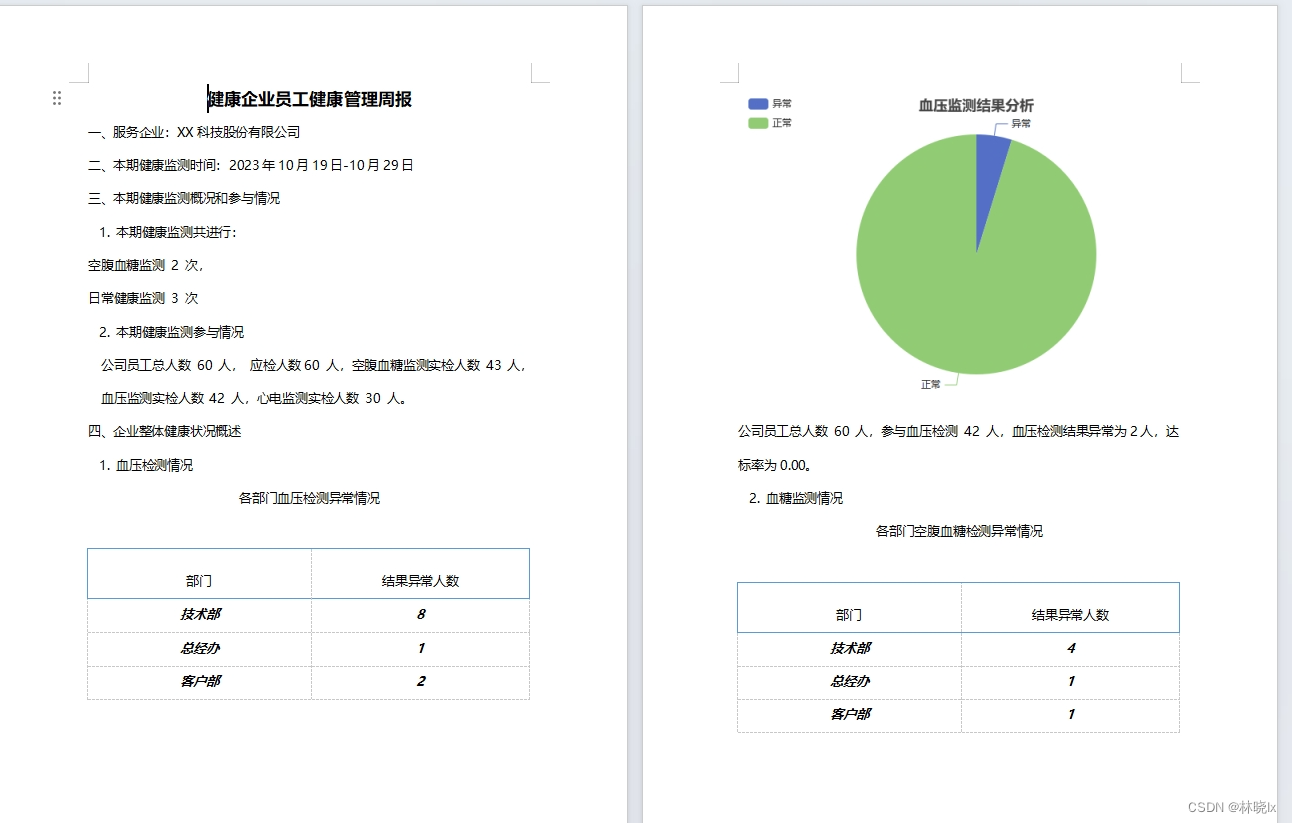
var option = new ChartOption()
{
title = new List<Title>()
{
new Title (){
text=title, left="center"}
},
tooltip = new ToolTip(),
legend = new Legend()
{
orient = OrientType.vertical,
left = "left"
},
series = new object[]
{
new {
name= "Access From",
type="pie",
data=new object[]
{
new { value= failedCount, name="异常" },
new { value= passCount, name="正常" },
}
}
}
}

根据Document Template Tool图片占位符格式:#字段名称[宽度,高度]#,

在上一章的Sample基础上,在ReportTemplate2.docx中添加图片占位符。

在这里插入图片描述

生成后的文档如下:

在这里插入图片描述

项目地址

库封装

https://github.com/jevonsflash/EChartsGen

本文示例 EChartsGen_DocTemplateTool_Sample

https://github.com/jevonsflash/EChartsGen/tree/master/EChartsGen_DocTemplateTool_Sample

将ECharts图表插入到Word文档中

https://blog.matoapp.net/posts/b91a8003/

作者

林晓lx

发布于

2023-11-15

更新于

2024-09-11

许可协议

评论